aews) eks log와 monitoring 살펴보기
이번 주차는 로깅부분을 보며, prometheus와 grafana를 사용해봤다. 설치하는 부분은 지난 스터디에 작성했던 블로그와 동일하게 헬름으로 배포했다. 🔗 그 차트안에 프로메테우스, 그라파나 등이 함께 설치되도록 되어있어서 한번에 간단하게 설치 가능하다. 지난번과 다른 것은 kops로 배포된 클러스터가 아닌 eks 클러스터이기 때문에 aws에서 관리되는 부분들을 비활성화해주어야했다.
# 스택 설치시 사용하는 value 파일
...
kubeControllerManager:
  enabled: false
kubeEtcd:
  enabled: false
kubeScheduler:
  enabled: false
...
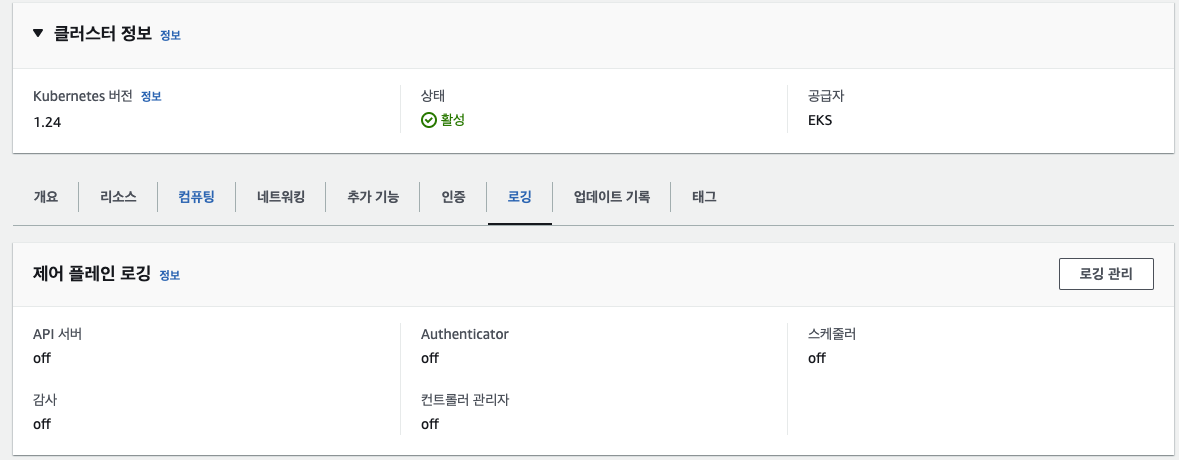
eks에서 controlplane은 aws의 관리 영역이며, 기본적으로 로깅이 꺼져있어서 확인하려면 활성화해줘야한다. 관리노드에 대해 총 다섯개의 로그를 나눠지며, 그 중 필요한 로그만 활성화 할 수 있다. 켜두면 로그가 엄청 많이 쌓이고.. 그것이 다 돈이므로, 잠까 켜서 로그가 들어오는지 확인하고 다시 비활성화 해줬다.
# CloudWatch > Logs Insights 확인가능
fields @timestamp, @message
| filter @logStream ~= 확인하고자 하는 로깅(예로 "kube-controller-manager")
cluster log (prometheus > cloudwatch)
install cloudwatch agent
클러스터 로그를 prometheus에서 logging으로 보내어 확인을 위해, cloud watch agent가 필요하다. 🔗
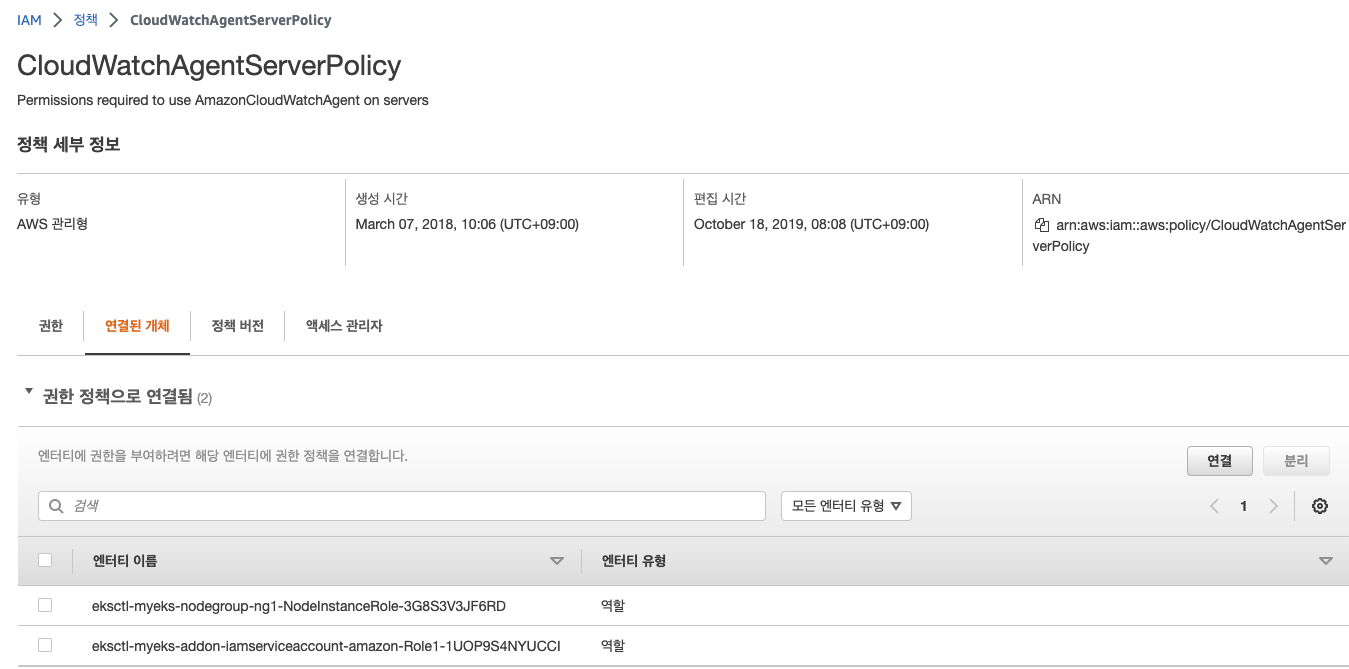
(eunyoung@myeks:default) [root@myeks-bastion-EC2 ~]# eksctl create iamserviceaccount \
>  --name cwagent-prometheus --namespace amazon-cloudwatch \
>  --cluster myeks --attach-policy-arn arn:aws:iam::aws:policy/CloudWatchAgentServerPolicy \
> --approve --override-existing-serviceaccounts
이렇게 정책을 할당하게 되면 클러스터의 노드들이 가진 iam에서도 정책이 붙어있는 것을 확인할 수 있다.
(eunyoung@myeks:default) [root@myeks-bastion-EC2 ~]# k create ns amazon-cloudwatch
(eunyoung@myeks:default) [root@myeks-bastion-EC2 ~]# curl -O https://raw.githubusercontent.com/aws-samples/amazon-cloudwatch-container-insights/latest/k8s-deployment-manifest-templates/deployment-mode/service/cwagent-prometheus/prometheus-eks.yaml

# prometheus-eks.yaml
...
 14   cwagentconfig.json: |
 15     {
 16       "agent": {
 17         "region": "ap-northeast-2"
 18       },
...
(eunyoung@myeks:default) [root@myeks-bastion-EC2 ~]# kubectl apply -f prometheus-eks.yaml
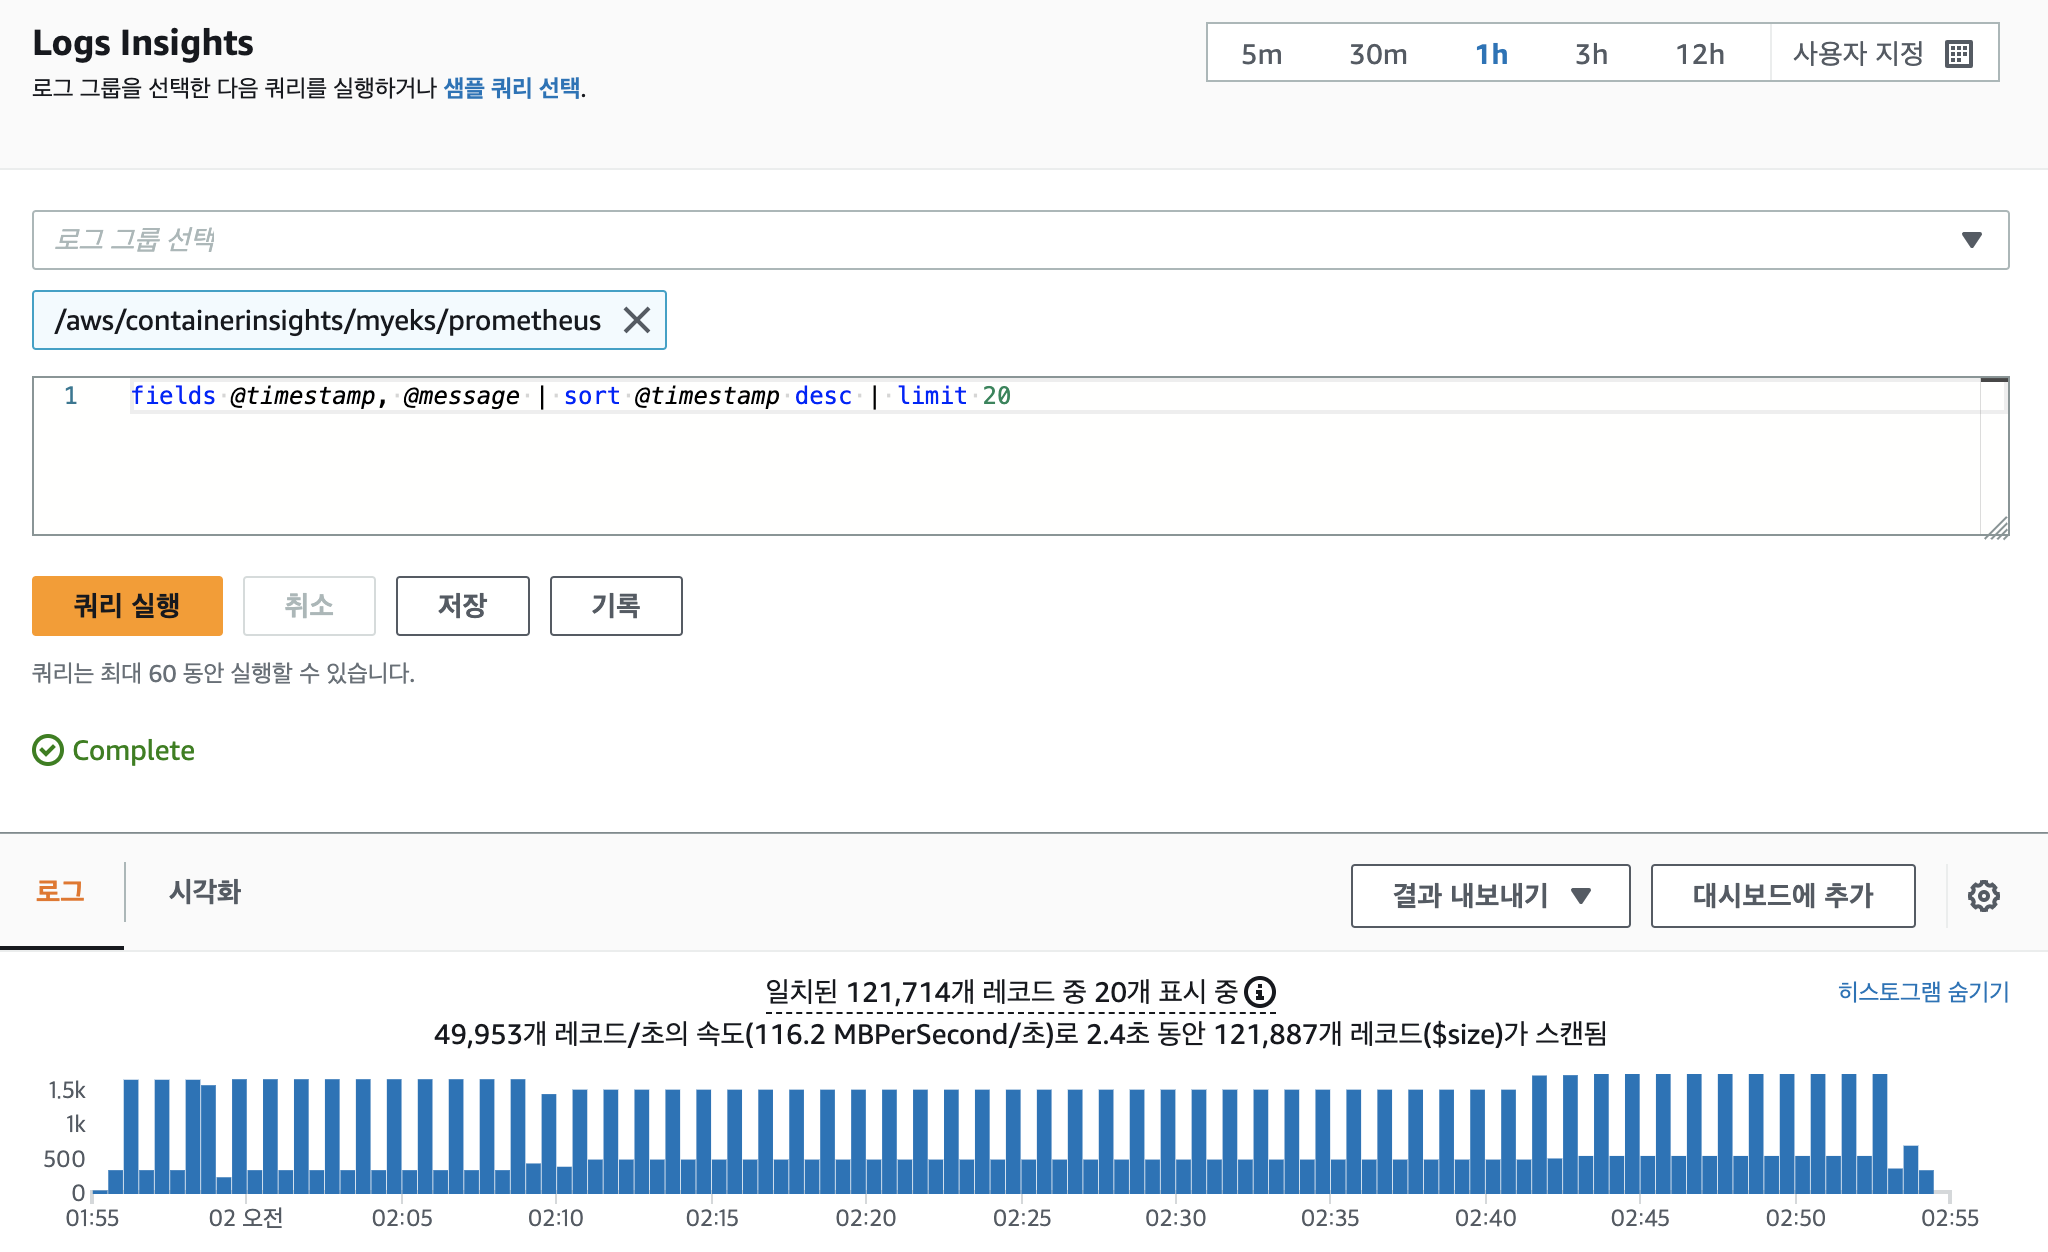
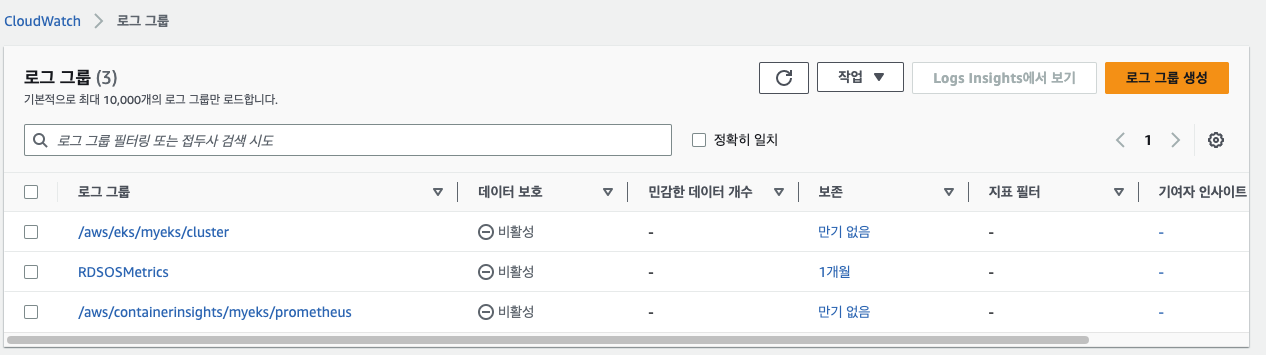 myeks cluster 로그 그룹 말고 /myeks/prometheus가 생긴 것을 확인 할 수 있다.
application log (prometheus > cloudwatch)
test server
테스트로 지난번과 동일하게 nginx로 올렸다.
service:
    type: NodePort

ingress:
  enabled: true
  ingressClassName: alb
  hostname: nginx.nyoung.xyz
  path: /*
  annotations:
    alb.ingress.kubernetes.io/scheme: internet-facing
    alb.ingress.kubernetes.io/target-type: ip
    alb.ingress.kubernetes.io/listen-ports: '[{"HTTPS":443}, {"HTTP":80}]'
    alb.ingress.kubernetes.io/certificate-arn: $CERT_ARN
    alb.ingress.kubernetes.io/success-codes: 200-399
    alb.ingress.kubernetes.io/load-balancer-name: myeks-ingress-alb
    alb.ingress.kubernetes.io/group.name: study
    alb.ingress.kubernetes.io/ssl-redirect: '443'

metrics:
  enabled: true
  service:
    port: 9113
  annotations:
    prometheus.io/path: "/metrics"

  serviceMonitor:
    enabled: true
    namespace: monitoring
    interval: 10s


# 호출시 이상없이 잘 동작한다.
(eunyoung@myeks:default) [root@myeks-bastion-EC2 ~]# curl -kL nginx.nyoung.xyz
<!DOCTYPE html>
<html>
<head>
<title>Welcome to nginx!</title>
...
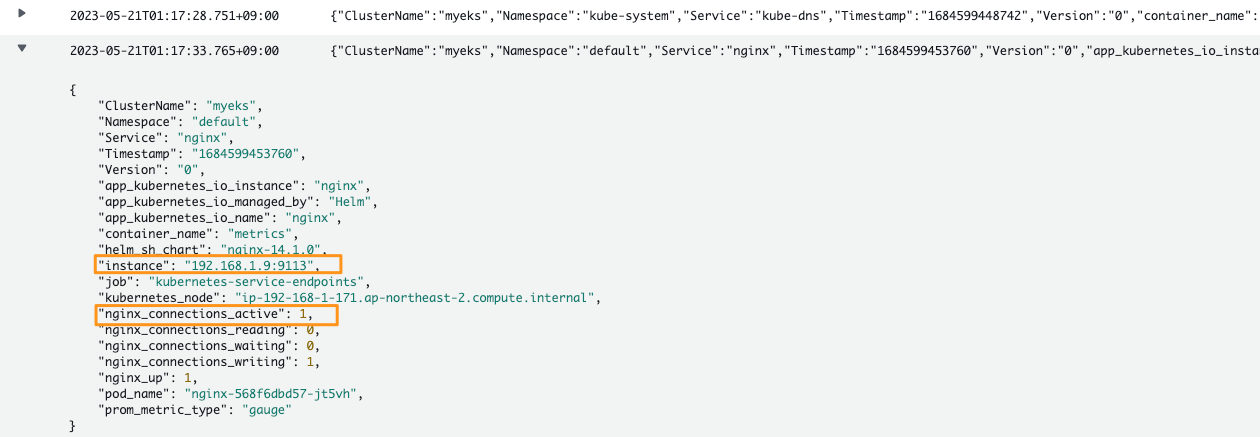
파드를 호출하여 nginx_connections_active를 확인
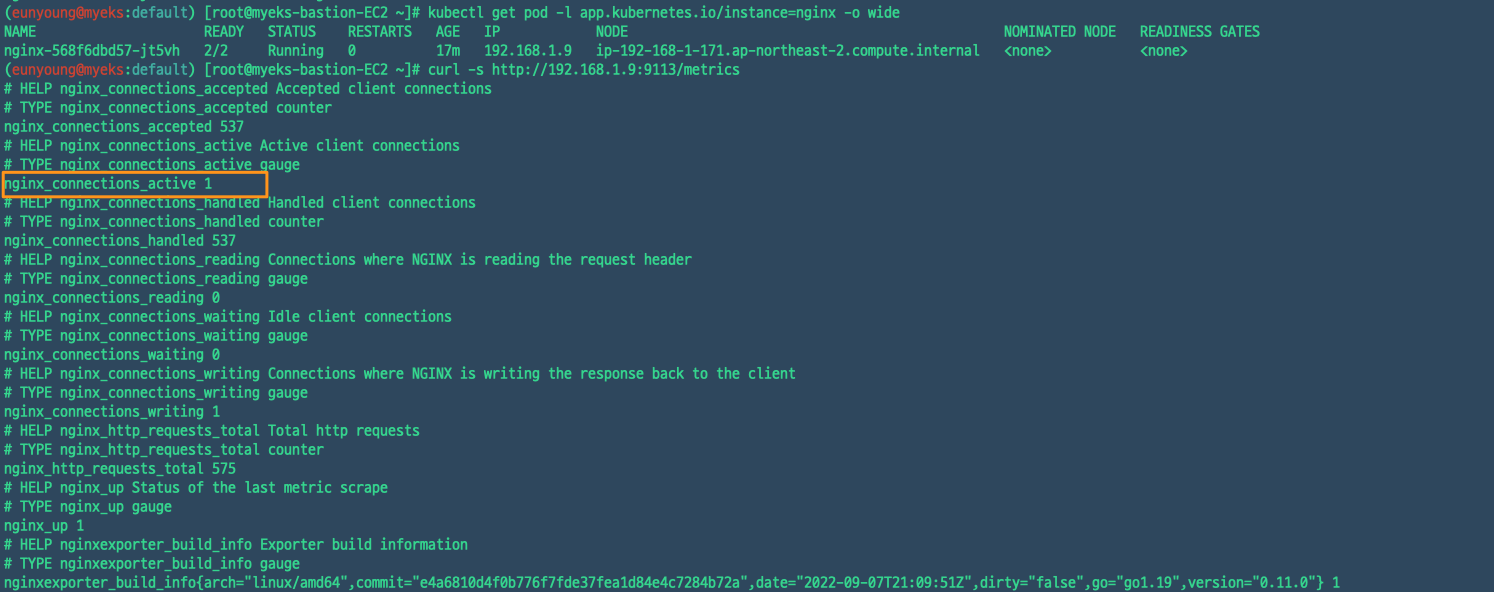
cloudwatch log에서도 동일한 정보를 확인 할 수 있다.
pod로 올린 nginx의 로그는 kubectl logs로 확인 할 수 있는데, pod에 접속하지 않고도 logs로 확인할 수 있는 이유는 로그가 표준출력(stdout)과 표준에러(stderr)로 심볼릭링크가 걸려있기 때문이다. 🔗 컨테이너의 로그는 stdout, stderr가 권장되면서 심볼릭링크를 걸거나 로그의 위치를 변경하여 사용하는 일이 많다. gcp의 경우에도 표준출력인 로그는 애플리케이션의 로그임에도 아무런 설정없이 바로 cloud logging에 쌓이게 된다.
install fluent bit
다양한 로그를 수집하기 위해 fluent bit을 설치했다. fluentbit을 사용하여 상태, 성능을 수집하여 cloudwatch dashboard에서 모니터링하고, container insight에서도 함께 사용가능하다. 문서에 따라 설치를 하게되면 fluentbit은 데몬셋으로 생성되어 노드에 있는 컨테이너의 로그까지 수집하게된다. 🔗
(eunyoung@myeks:default) [root@myeks-bastion-EC2 ~]# FluentBitHttpServer='On'
(eunyoung@myeks:default) [root@myeks-bastion-EC2 ~]# FluentBitHttpPort='2020'
(eunyoung@myeks:default) [root@myeks-bastion-EC2 ~]# FluentBitReadFromHead='Off'
(eunyoung@myeks:default) [root@myeks-bastion-EC2 ~]# FluentBitReadFromTail='On'
(eunyoung@myeks:default) [root@myeks-bastion-EC2 ~]# curl -s https://raw.githubusercontent.com/aws-samples/amazon-cloudwatch-container-insights/latest/k8s-deployment-manifest-templates/deployment-mode/daemonset/container-insights-monitoring/quickstart/cwagent-fluent-bit-quickstart.yaml | sed 's//'${CLUSTER_NAME}'/;s//'${AWS_DEFAULT_REGION}'/;s//"'${FluentBitHttpServer}'"/;s//"'${FluentBitHttpPort}'"/;s//"'${FluentBitReadFromHead}'"/;s//"'${FluentBitReadFromTail}'"/' | kubectl apply -f -


(eunyoung@myeks:default) [root@myeks-bastion-EC2 ~]# kubectl describe cm fluent-bit-config -n amazon-cloudwatch
configmap을 확인해보면 host-log, application-log, dataplane-log 세가지를 수집하는 것을 볼 수 있다. host-log는 /var/log/ 밑의 노드(호스트) 단에서의 로그를, application-log는 /var/log/contatiner/ 아래에서 로그를 수집한다. 마지막으로 datplane-log는 설치된 서비스들에 대해 수집을 하고, output을 보면 각 로그마다 log group이 생겨 cloudwatch로 보내지게 된다.
그렇게 해서 생긴 많은 로그 그룹들
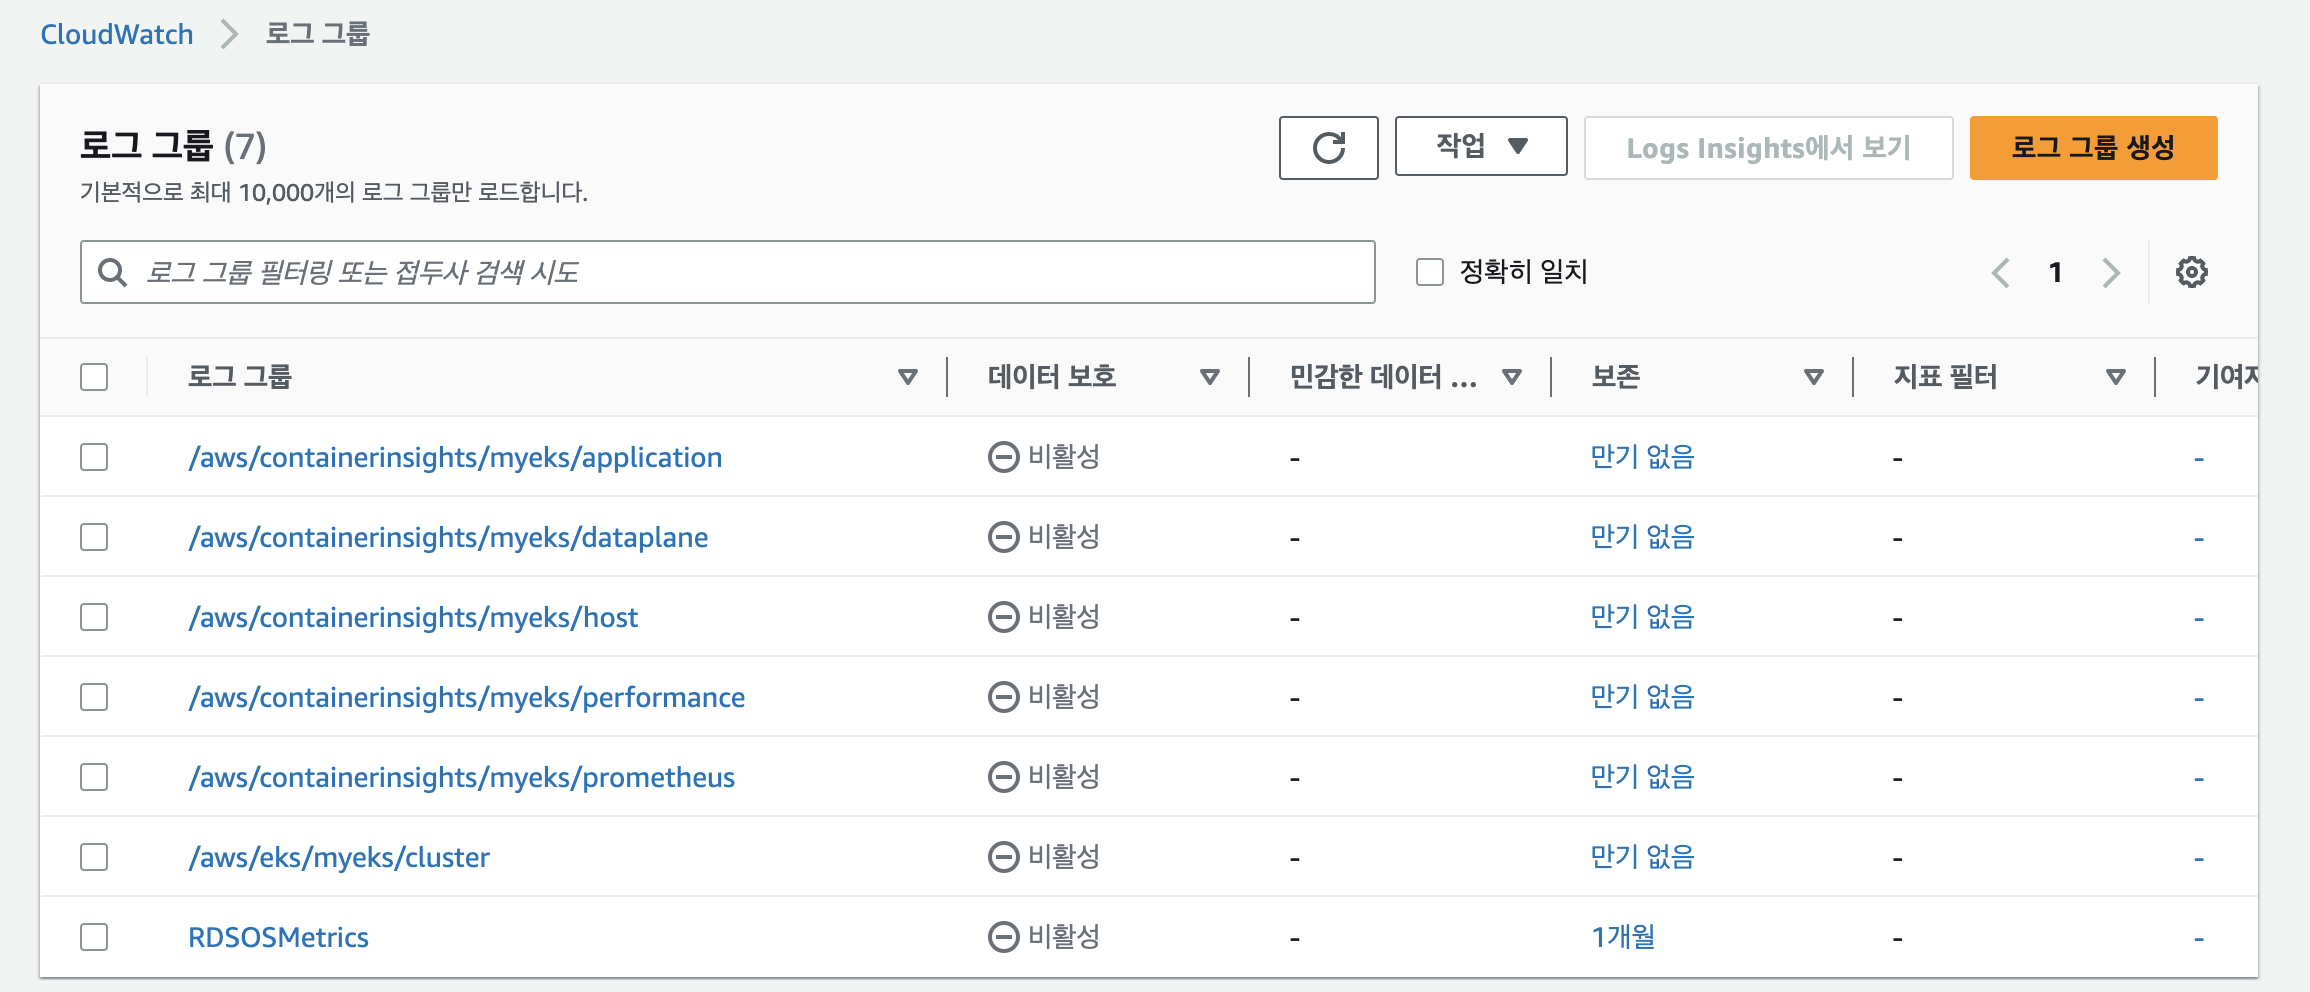
로그 그룹 하나에 들어가서 보면, 잘 쌓여가는 것을 볼 수 있다.
create dashbaord
# https://docs.aws.amazon.com/AmazonCloudWatch/latest/monitoring/ContainerInsights-Prometheus-viewmetrics.html
# json파일을 받아서 치환해줬다. (변경해야할 것이 은근 있음)

(eunyoung@myeks:default) [root@myeks-bastion-EC2 ~]# sed -i 's//$CLUSTERNAME/g' nginxdashboard.json
(eunyoung@myeks:default) [root@myeks-bastion-EC2 ~]# sed -i 's//$AW_RESION/g' nginxdashboard.json
하고 짜란..하면 나와야하는데 안나온다.
🔗 이거보고 scrape_config도 수정해보고, 🔗 이거보고 확인도 해봤지만.. 사용가능한 데이터가 없다는 메세지만 뜬다..😇 prometheus에서도 잘있고, 그라파나에서도 잘보이고 cloudwatch log에도 있는데말이다.